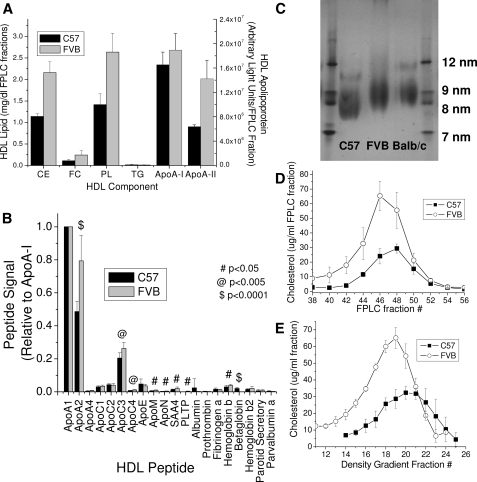
Fig. 1.
HDL from FVB mice are enriched in cholesterol, phospholipid, and ApoA-II when compared with C57 mice. HDL isolated from each mouse strain was evaluated for (A) major lipid and apoprotein content (by SDS-PAGE), (B) total apoprotein content (by mass spectral quantitation), (C) lipoprotein size by native gel electrophoresis, or (D) lipoprotein size by FPLC fractionation of whole plasma followed by cholesterol analysis, and (E) lipoprotein density by density gradient centrifugation as described in Materials and Methods. Data points show the mean ± SD of triplicate samples (A, D, and E), 10 samples (B), or four samples (C).

