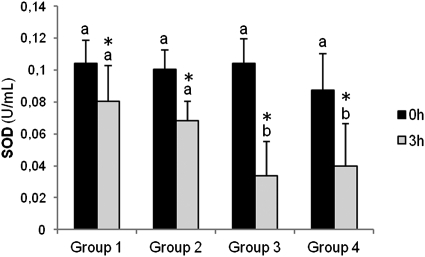
Fig. 1.
Baseline and postprandial plasma superoxide dismutase activity in the four study groups. Results are presented as means ± SD. Different letters indicate significant differences between the study groups (ANOVA, Bonferroni test). *P < 0.05 between baseline and postprandial values. Group 1: patients with HOMA-IR ≤ 5 and ΔTG < 80 mg/dl; Group 2: patients with HOMA-IR > 8 and ΔTG < 80 mg/dl; Group 3: patients with HOMA-IR ≤ 5 and ΔTG > 80 mg/dl; Group 4: patients with HOMA-IR > 8 and ΔTG > 80 mg/dl. SOD, superoxide dismutase.

