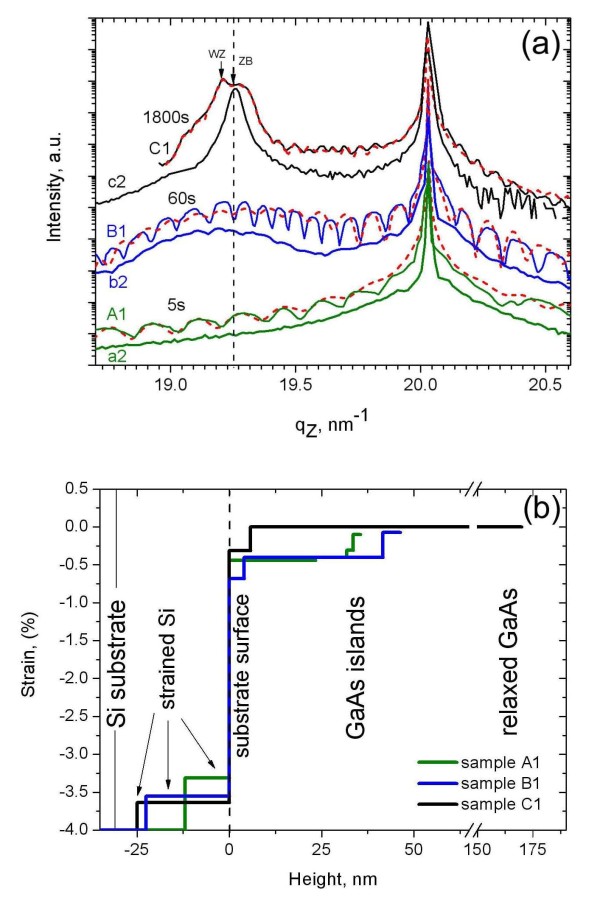
Figure 2.
HRXRD curves and lattice parameters. (a) HRXRD curves of all samples; the dotted lines are the results of simulations. (b) Lattice parameters as a function of height above the Si surface were obtained by the simulations of the curves shown in (a). Values are shown as the lattice parameter difference with respect to the unstrained GaAs lattice. A thickness up to 25 nm below the Si surface is affected during the GaAs growth. The GaAs lattice shows a gradual increase in lattice parameter.

