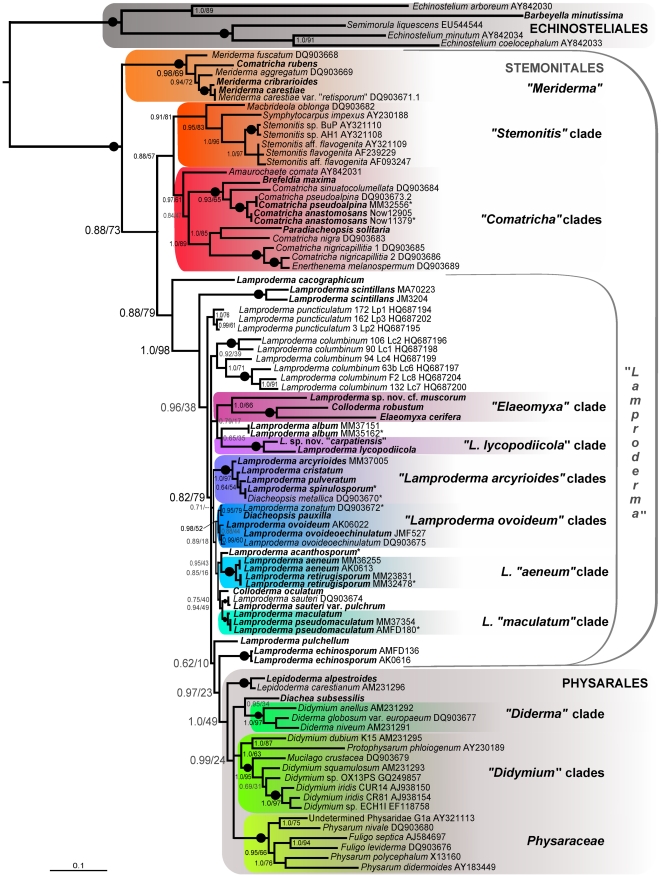
Figure 2. SSU rDNA gene tree of selected Stemonitales and Physarales derived by Bayesian inference of 1566 nucleotide positions of 84 taxa.
Species names are followed by GenBank accession number, except for sequences obtained during this study (in bold), whose accession numbers and collection sites are in Table S1; sequences are marked by an asterisk if partial. Clades including more than one species are highlighted by a rectangle and arbitrarily named. Names of orders are in capitals (in grey if paraphyletic). Bayesian posterior probabilities (BPP)/ML bootstrap replicates (MLB) are shown for each branch, a dot on the line indicates maximum support in both analyses. Grey numbers indicate low support (BPP<0.9 or MLB<70%), dashes indicate a conflicting topology in the ML tree. The scale bar indicates the fraction of substitutions per site.

