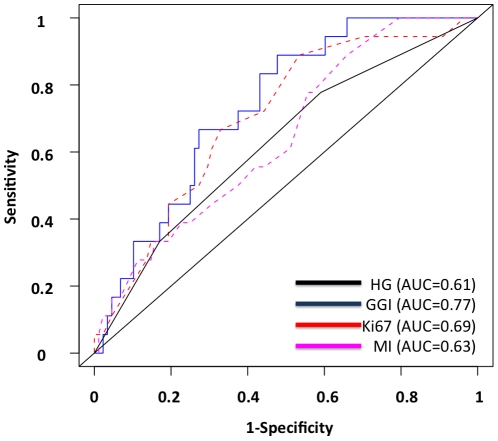
Figure 2. Prediction of metastases events at 10 years of follow-up from initial diagnosis.
Receiver Operating Curves. 106 Estrogen Receptor positive HER2 negative samples with 10-year follow-up data. Blue: Genomic Grade Index (GGI); Red: Ki67; Black: Histological Grade (HG); Pink: Mitotic Index (MI).

