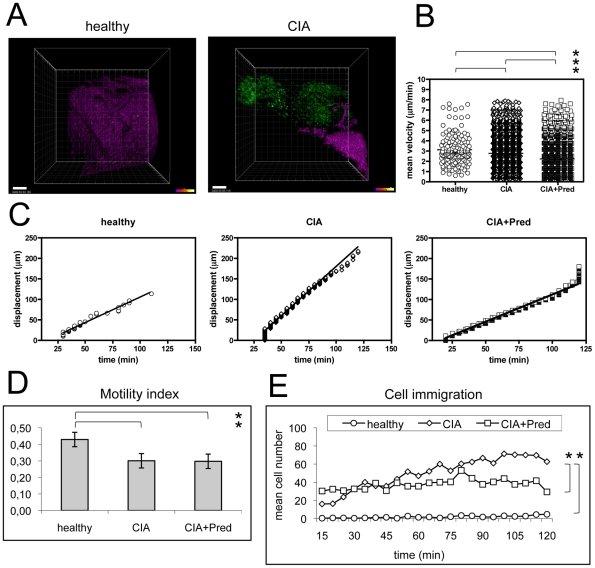
Figure 2. Kinetics of cell migration.
A) Comparative real time in vivo analysis of cell migration in healthy versus CIA subjects were performed in C57BL/6 lysM-EGFP animals. GMC cells with the expression of EGFP (green) are rarely found in healthy tissue, whereas they are abundant in the synovial tissue of CIA subjects. The magenta signal displays a second harmonic generation (SHG) of collagen structures (see also Movie S1). Scale bars (left corner) represent 100 µm. Representative pictures are shown from movies that were made in three healthy control subjects and three subjects with CIA. B)–D): Quantification of cell velocity (b), displacement over time (c) and the motility index (total displacement/cumulative path length) (d) are shown for GMC cells in healthy subjects, in CIA subjects (CIA) and in CIA subjects treated with prednisolone (CIA+Pred). For (b) and (c), data points represent individual cells (healthy: n = 142; CIA: n = 4055; CIA+Pred: n = 3787) compiled from three independent imaging sessions involving individual joints of three animals. Mean values±s.e.m. are shown. Graph bars show mean±s.e.m. (d). Asterisks (*) indicate significant p values (<0.05). E) Cell immigration describes the number of cells immigrating into the ROI at each time point. Few cells immigrate in healthy subjects. CIA diseased subjects start with high numbers of GMC cells and increasing numbers of cells immigrate into the scanned area. Prednisolone stabilizes cell immigration to comparable numbers of cells immigrating at each time point. Data are mean values from experiment that were performed in three healthy controls, three CIA subjects and three CIA+Prednisolone subjects. Asterisks (*) indicate significant p values (<0.05).

