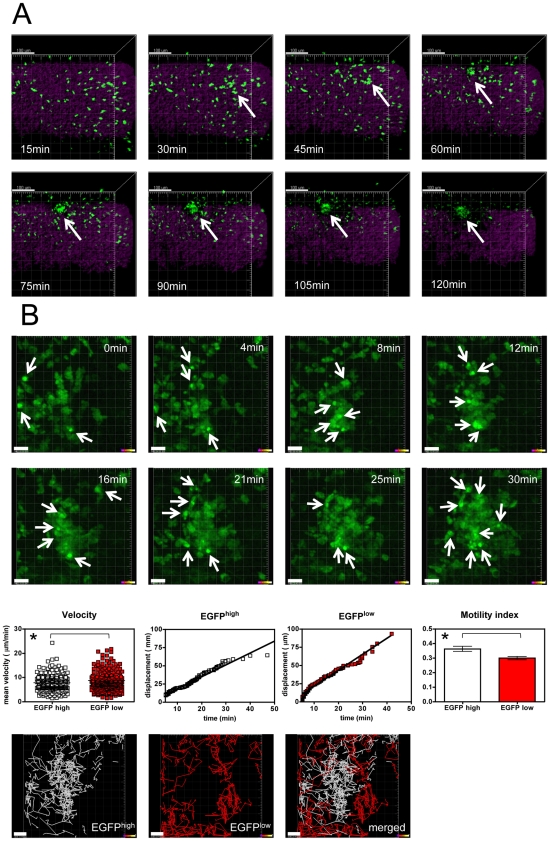
Figure 3. GMC cluster formation.
A) Real time in vivo cell cluster formation (arrow) during a 2 h time interval. Individual pictures were taken at the indicated time points (Green channel: EGFP+ GMC cells, magenta channel: SHG of collagen structures). Scale bars represent 100 µm. Representative pictures are shown from movies that were made in three healthy control subjects and three subjects with CIA. B) Real time in vivo cell cluster formation during a 30 min time interval at higher magnification. Individual pictures of EGFP+ cells were taken at the indicated time points. Arrows point at individual cells with high EGFP fluorescence expression intensity. Scale bars represent 15 µm. Representative pictures are shown from movies that were made in three subjects with CIA. Quantification of cell velocity, displacement over time and the motility index (total displacement/cumulative path length) are shown for EGFPhigh (defined as 30% of EGFP+ cells with highest mean fluorescence intensity of EGFP) and EGFPlow (defined as 30% of EGFP+ cells with lowest mean fluorescence intensity of EGFP) cells. Data points represent individual cells (EGFPhigh: n = 216; EGFPlow: n = 202) compiled from three independent imaging session from individual joints of three CIA animals. Graph bars show mean±s.e.m. from the same experiments. Asterisks (*) indicate significant p values (p<0.05). Cumulative cell tracks are shown from one representative experiment for EGFPhigh, EGFPlow and both (merged) cell populations. Scale bars represent 15 µm.

