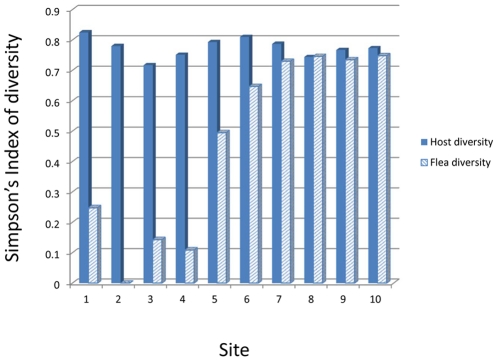
Figure 4. Comparison of host and flea diversity among sampling sites.
Host diversity indices were similar between sites above (7–10) and below (1–6) the 1300 m elevation threshold. Flea diversity was significantly higher for sites above 1300 m than below; Wilcoxon rank sums test with chi square approximation χ = 6.55 d.f. = 1 P = 0.01).

