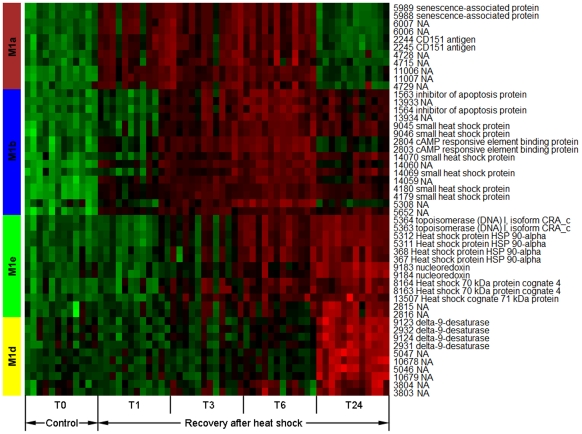
Figure 2. Heat map visualization of coexpression patterns of hub genes in submodules M1a, M1b, M1d and M1e.
T0 represents an oyster control without heat treatment, whereas time points T1, T3, T6 and T24 represent recovery time (hour) after heat shock. Probe IDs and their associated gene annotations are shown on the right of the heat map. Red, up-regulation; Green, down-regulation.

