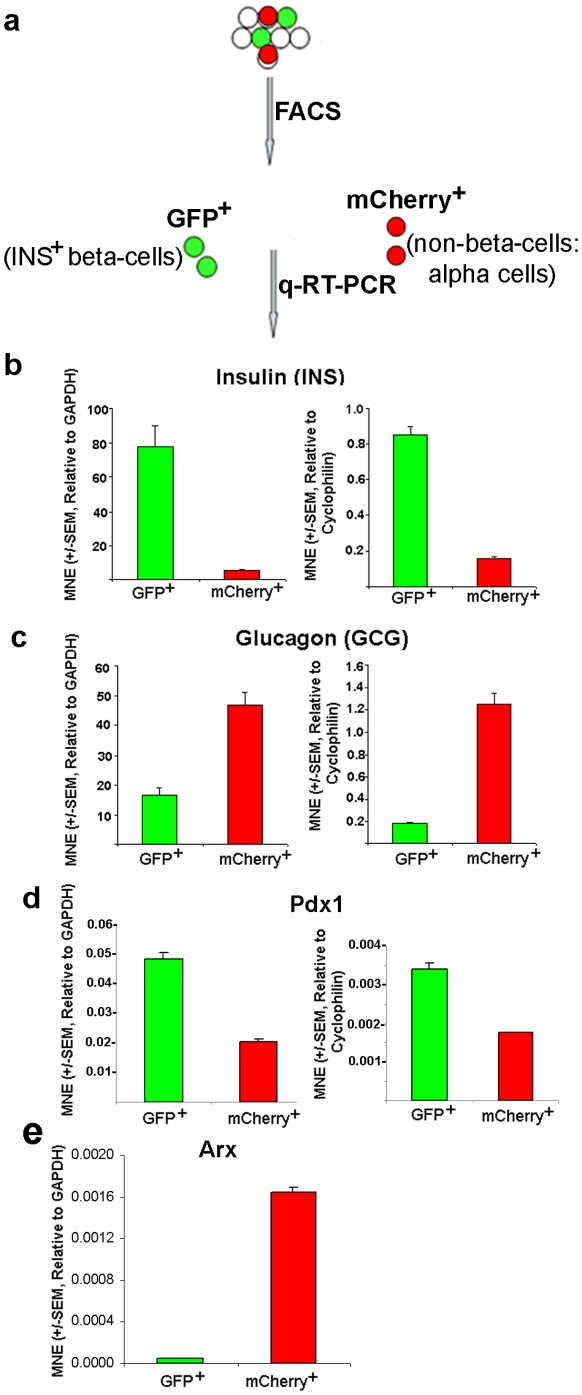
Figure 4. INS and GCG transcript expression in FACS-sorted GFP+ and mCherry+ cells using q-RT-PCR.
(a) After FACS analysis in stable HIT-T15 cell population to select GFP+ or mCherry+ cells, q-RT-PCRs were performed in GFP+ and mCherry+ cells. (b, c) q-RT-PCR data confirmed that the green and red cells were insulin- and glucagon-producing, respectively. (d, e) The green and red cells were analyzed for expression levels of Pdx1 (d) and Arx (e) genes by q-RT-PCR. The expression levels of INS, GCG, Pdx1, and Arx transcripts were normalized to the housekeeping genes, GAPDH and/or Cyclophilin (“MNE"). The error bars represent standard error (SEM) of the mean (N = 3 for each experiment).

