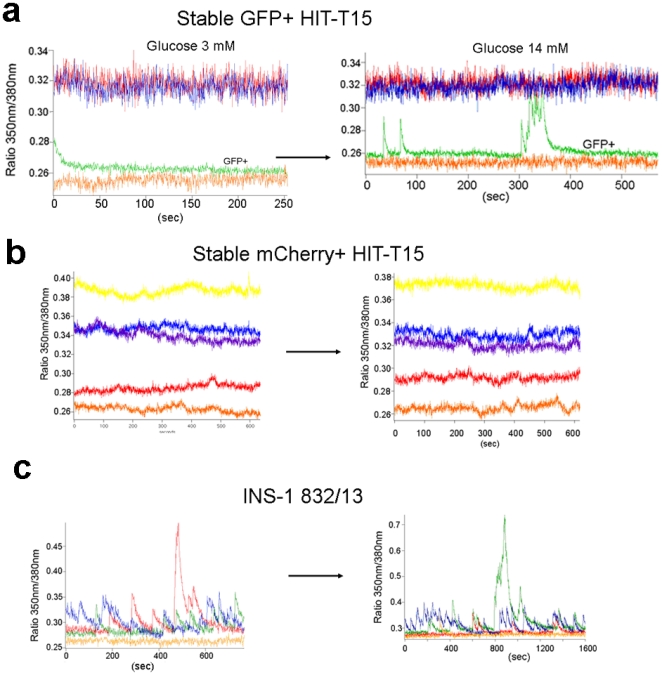
Figure 6. Intracellular Ca2+ concentration, [Ca2+]i changes associated with glucose stimulation in different fluorescent cells.

(a) Glucose responsiveness of GFP+ stable HIT-T15 cells. The green line represents a GFP+ cell in basal (3 mM, left panel) and stimulatory (14 mM, right panel) levels of glucose. The other lines (red, blue, and orange) represent non-fluorescent cells. (b) No glucose responsiveness of mCherry+ stable HIT-T15 cells was observed. (c) Fluorescence traces from INS-1 cells. Each color represents a different cell, indicating spontaneous Ca2+ oscillations arising from action potentials.
