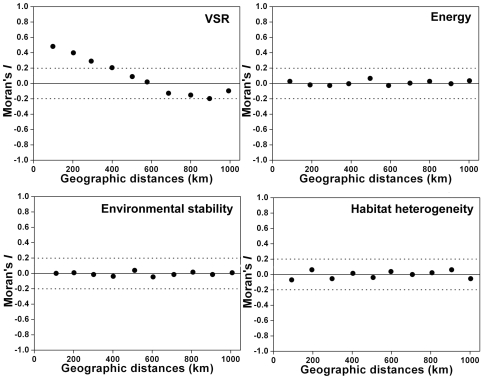
Figure 2. Spatial correlograms (Moran's I coefficients) for the VSR and the residuals of the best-fit GLMs of energy, environmental stability, and habitat heterogeneity variable groups.
Ten distance classes (100, 200, 300, 400, 500, 600, 700, 800, 900, and 1000 km) were included. The dotted lines represented the Moran's I values of 0.2 and −0.2.

