
Figure 6.

Left: Clustering score in dependence on the index of the used feature vectors. The colors indicate the number of features used for the hierarchical clustering. From left to right: blue (7 features), green (6), orange (5), purple (4), brown (3). The red surrounded dot (index  ) corresponds to the lowest score that was obtained for the features:
 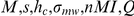 . Right: Complementary cumulative distribution function (CCDF) for each of the eight features in dependence on the score.