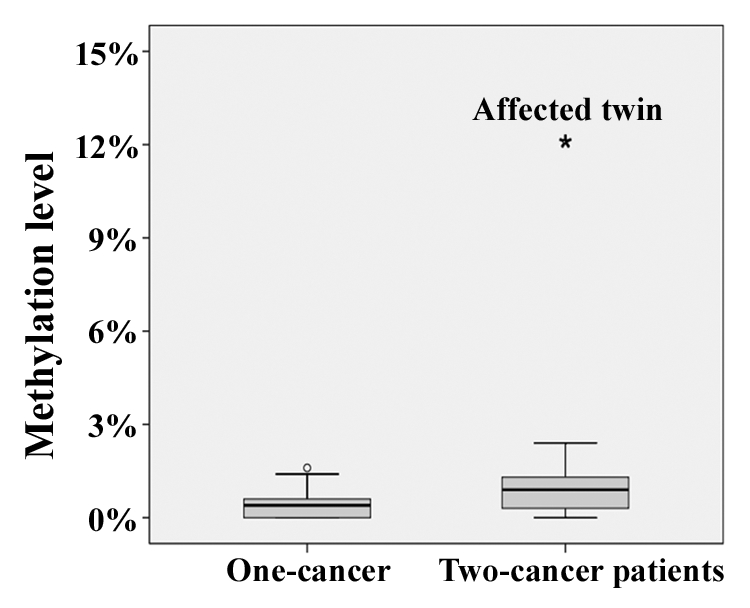
Figure 1. Box plots showing the distribution of BRCA1 methylation values in fibroblasts of 10 one-cancer and 10 two-cancer patients. The star symbol (extreme outlier) represents the affected twin. The median is represented by a horizontal line. The bottom of the box indicates the 25th percentile, the top the 75th percentile. The T bars extend from the boxes to 1.5 times the height of the box.
