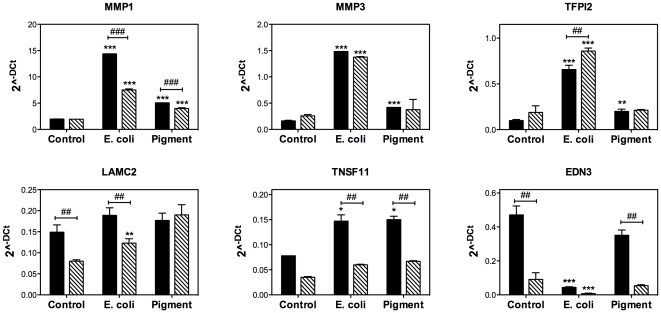
Figure 2. Quantitative real-time PCR confirmation of selected genes with differential expression in phagocytically challenged human TM cells under physiological (black bars) and oxidative stress (stripped bars) conditions.
The expression levels were calculated using the formula 2−ΔCt, where ΔCt = Ctgene−Ct average housekeeping. β-Actin, GAPDH, and HPRT1 served as internal standard for normalization. Values represent mean ± SD. (*) compares phagocytically challenged versus control cultures; (#) compares oxidatively stressed versus cultures grown under physiological conditions. *, # p<0.05, **, ## p<0.005, ***, ### p<0.0005 (t-test, n = 3).

