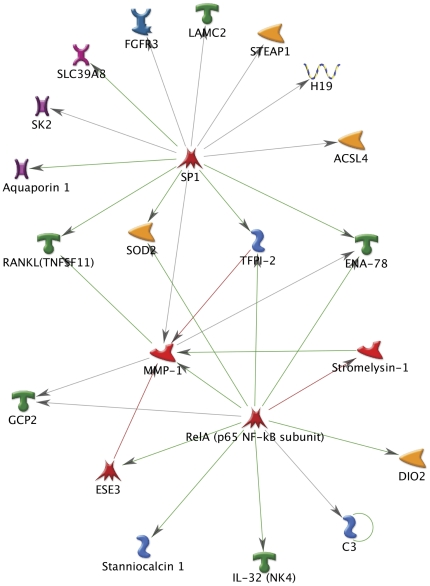
Figure 4. Pathway analysis of the genes showing changes in expression higher than 1.5 fold (p<0.05) in human TM cells phagocitically challenged to E.coli and pigment.
NF-kB and SP1 were identified as the transcription factors with the highest ranking in terms of P-value and gene ontology interpretation.

