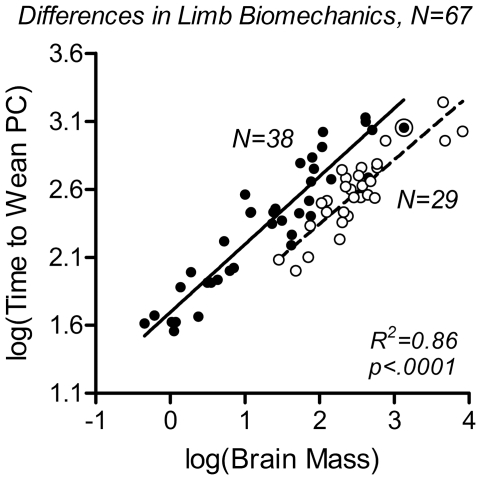
Figure 3. Limb biomechanics is a predictor of time to weaning.
Time to weaning was plotted as a function of the continuous variable adult brain mass, log (Brain Mass), and the grouping variable ‘limb biomechanics’ (see main text and Materials and methods for definition; Table S1). Filled symbols and solid regression line represent species that can assume a plantigrade standing of the hindlimb (N = 38); open symbols and dashed regression line represent ‘non-plantigrade’ species, in the present sample including digitigrade and unguligrade species and those that have either rudimentary or completely lack external hindlimbs (N = 29). Double circle: humans. The grade shift between the two groups was highly significant. R2- and p-values for the multiple regression model are given in the diagram. The difference between this R2-value and the R2-value in Fig. 2 corresponds to the additional amount of variance accounted for by the grouping variable ‘limb biomechanics’.

