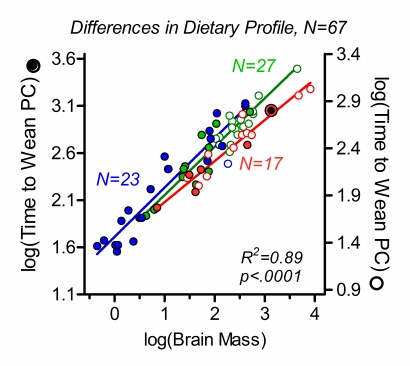
Figure 4. Dietary profile is a predictor of time to weaning.
To illustrate the importance of the grouping variable ‘dietary profile’ independently of the grouping variable ‘limb biomechanics’, the grade shift shown in Fig. 3, of about 0.25 units along the Y-axis, has been compensated for by a shift between the left (filled circles; species that can assume plantigrade hindlimb position) and right (open circles; ‘non-plantigrade’ species, which cannot assume plantigrade hindlimb position) Y-axes. In this way, original data rather than values corrected for residual variance can be shown for both groups. Carnivorous, omnivorous and herbivorous species are shown red (N = 17), blue (N = 23) and green (N = 27), respectively. Double circle: humans. Solid lines: Model II linear regression (reduced major axis) on all species within in each dietary category (independently of limb biomechanics) are shown in matching colors. R2- and p-values from the multiple regression analysis described in main text are given in the diagrams. For full model equation see main text. The difference between this R2-value and the R2-value in Fig. 3 corresponds to the additional amount of variance accounted for by the grouping variable ‘dietary profile’.

