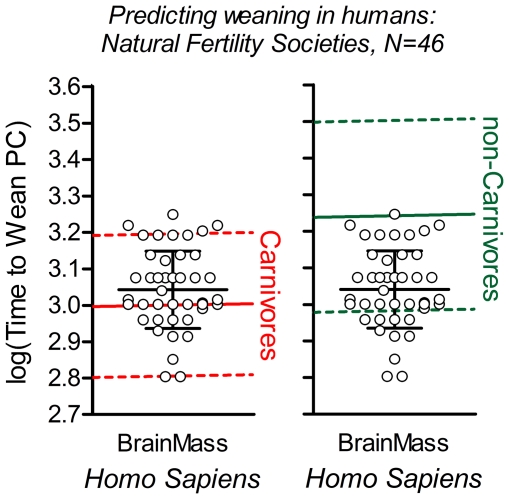
Figure 5. Time to weaning in humans is quantitatively predictable from a carnivorous diet.
Predictions of time to weaning in humans based exclusively on species with a carnivorous (left panel, red) or a non-carnivorous diets (right panel, blue-green) were compared to a global sample of human natural fertility societies, shown as open circles (N = 46). Note that human Brain Mass is equal for all individual data points, but a scattered plot was used in order for the reader to be able to distinguish different data points with identical time to weaning. Solid colored lines: regression lines illustrating predicted mean values for time to weaning in carnivorous (red) and non-carnivorous (blue-green) species (omnivores and herbivores were pooled; cf. Fig. 4); dashed lines: 90% prediction lines. Long black horizontal line: mean value of time to weaning of the 46 human natural fertility societies; short black lines: +/−1SD [5]. See main text for prediction of time to weaning in humans based on the full model.

