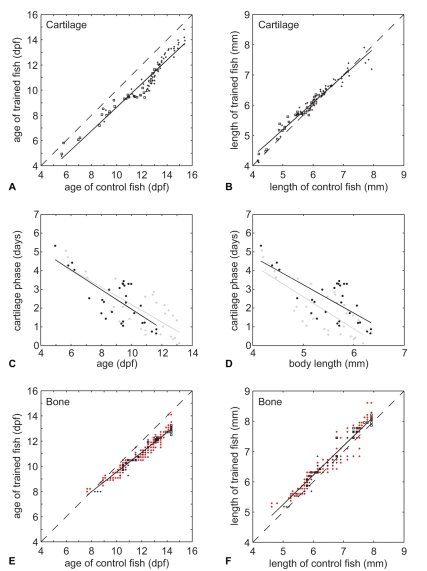
Figure 2. Swim-training accelerated both chondrogenesis and osteogenesis.
A) CF50age values of trained fish plotted against CF50age values of control fish with a linear regression fit (solid line). Dashed line is a reference line which indicates the CF50age values which are not different between control and trained fish. Plus signs indicate cartilage structures without BF50age values, squares are with BF50age values. B) Similar plot as in A but with CF50lgt values. C) Duration of cartilage phase for cartilage bones (in days, indicated with squares in A and E) plotted against the CF50age values of control and trained fish with a linear regression fit (solid lines) (trained fish: black dots and black regression line, control fish: grey dots with grey regression line). D) Similar plot as in C but with duration of cartilage phase (days) plotted against the CF50lgt values of control and trained fish. E) Similar plot as in A but with BF50age values. Red dots indicates BF50age values of dermal bones, plus signs of cartilage bones without CF50age values, squares of cartilage bones with CF50age values. Dashed line see A. F) Similar plot as in E but with BF50lgt values.

