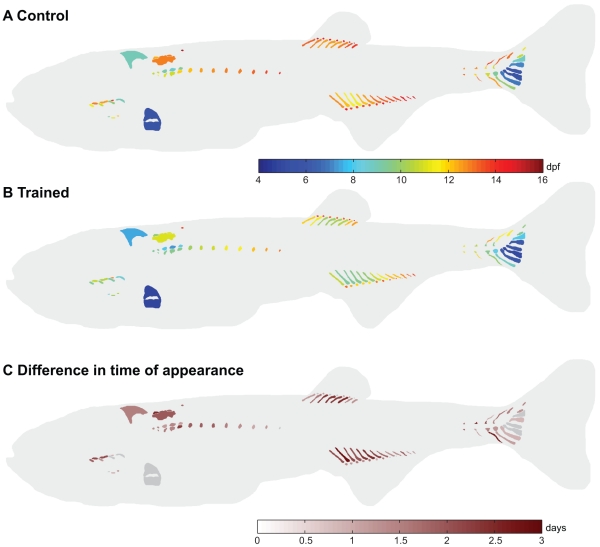
Figure 3. Swim-training had a differential effect on the age at appearance of cartilage structures between control and trained fish.
A,B) CF50age values visualized in the corresponding structures in control fish (A) and trained fish (B). C) Differences in CF50age values between control and trained fish. Positive values indicate that structures appear earlier in the trained fish. Structures with a difference less than twice the standard error are indicated in grey.

