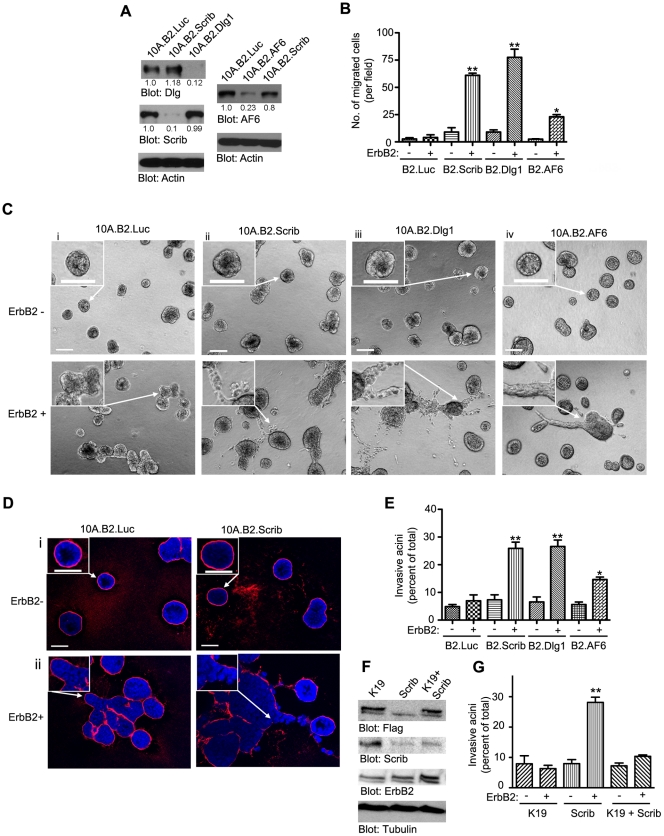
Figure 1. Loss of Scribble, Dlg1 or AF6 cooperates with ErbB2 activation to promote migration and invasion in MCF-10A cells.
(A) Immunoblot of lysates from 10A.B2 expressing control (Luciferace, 10A.B2.Luc) or Scribble (10A.B2.Scrib) or Dlg1 (10A.B2.Dlg1) or AF6 (10B2.AF6) shRNAs. (B) Transwell cell migration assay in of cell lines in Panel A in the presence (+) or absence (−) of the ErbB2 activator. The graph represents mean of three independent experiments ± S.E.M. *, p<0.05, **, p<0.005. calculated using an unpaired t-test comparing ErbB2-activated polarity-gene knockdown cells with Luc control cells. (Ci-iv) Morphology of 3D acini derived from 10A.B2.Luc,10A.B2.Scrib, 10A.B2.Dlg1 and 10A.B2.AF6 cells grown in M/Col-I in absence (ErbB2−) or presence (ErbB2+) of ErbB2 activator. Scale bars, 100 µm. (Di-ii) M/Col-I grown 10A.B2.Luc or 10A.B2.Scrib acini treated or untreated with ErbB2 activator fixed and immunostained for Laminin (Red) and DAPI-stained for nuclei (Blue). Scale bars, 50 µm. Arrows indicate area of the image magnified in the inset. (E) Percentage of acini showing invasive protrusions were quantified and mean (± S.E.M.) plotted from at least three independent experiments. *, p<0.05 based on an unpaired t-test comparing ErbB2-activated polarity-gene knockdown B2 cells and control Luc.B2 cells. (F) Lysates from 10A.B2 and 10A.B2.Scrib transfected with Par6K19A-Flag (K19 and K19+Scrib) or untransfected (Scrib) cells were immunoblotted for Flag to show Par6.K19A overexpression. ErbB2 blot shows expression levels of ErbB2 in transfected and untransfected lines. (G) Percentage of invasive acini quantified and mean ± S.E.M. plotted for K19, Scrib and K19+Scrib cells. Note the suppression of invasion in K19+Scrib cells compared to Scrib knockdown cells. **, p<0.005 in an unpaired t-test comparing ErbB2− and ErbB2+ in Scrib knockdown cells. See Materials and Methods for details.

