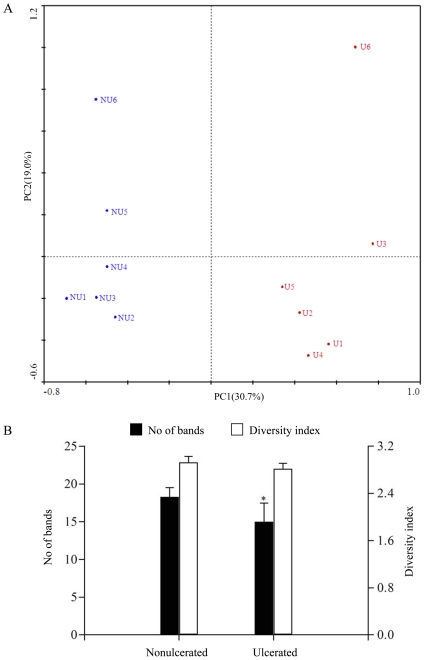
Figure 5. The plots of principal component analysis of microbial composition and diversity in mucosa-associated microbiota.
(A) PCA plot of the mucosa-associated microbiota in CD patients. The plot demonstrated the difference of bacterial communities adhered in the ulcerated and nonulcerated sites. The percentage of variation explained by each principal component is shown in brackets. (B) Biodiversity of mucosal bacterial microbiota from the ulcerated and nonulcerated ileum. The mean values and standard deviation (bars) are shown. *, p<0.05.

