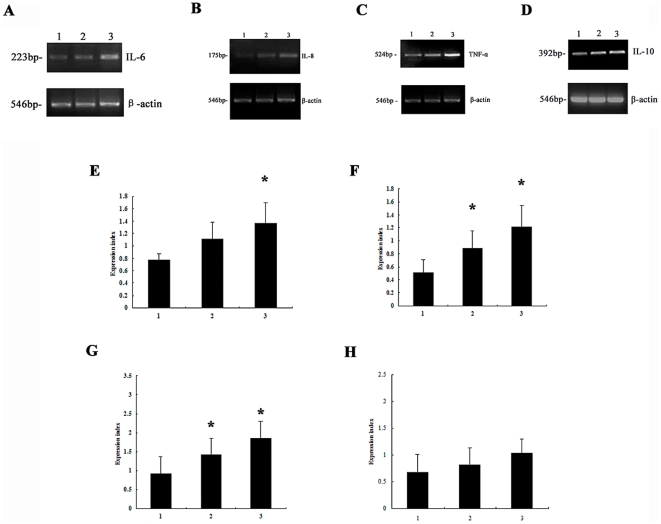
Figure 3. Expression levels of cytokine mRNA in neutrophils.
1, control; 2, treated with 5 nmol/L rPVL for 5 h; 3, treated with 100 nmol/L rPVL for 5 h. Representative agarose-gel photographs showing the expression level of IL-6 (A), IL-8 (B), TNF-α (C) and IL-10 (D) mRNA from neutrophils by RT-PCR analysis. The relative levels of IL-6 (E), IL-8 (F), TNF-α (G) and IL-10 (H) expressed were compared with β-actin levels. * P<0.05.

