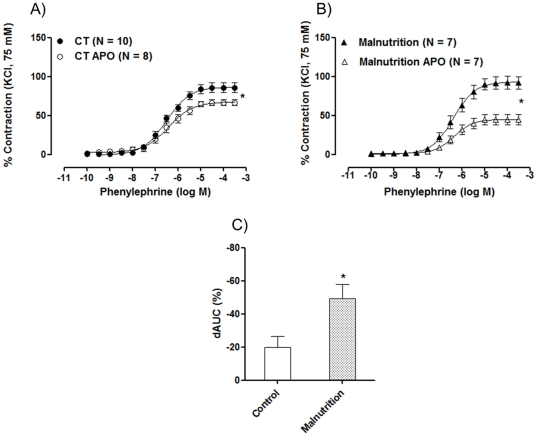
Figure 4. Concentration-response curve to phenylephrine in isolated aortic rings from (A) control (CT) and (B) post-weaning protein malnutrition (Malnutrition) rats before (E+) and after incubation with apocynin (APO).
C) Comparison of the percent difference of the area under the curve (% dAUC) in vessels in presence or absence of apocynin from control (CT) and post-weaning protein malnutrition (Malnutrition) rats. The number of preparations is indicated in parenthesis. The results are expressed as the means ± SEM. * P<0.05 for Rmax: CT E+ vs. CT APO; Rmax: Malnutrition E+ vs. Malnutrition +APO and dAUC% CT vs. Malnutrition by Student's t-test.

