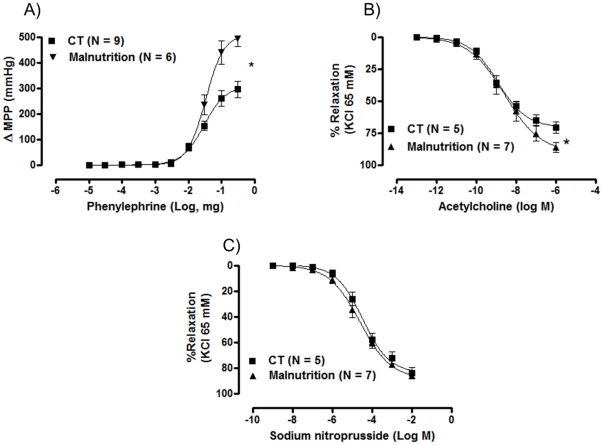
Figure 5. (A) Changes in the mean perfusion pressure (MPP) produced by phenylephrine (PHE) in tail vascular beds from the control (CT) and post-weaning protein malnutrition groups (Malnutrition).
(B) Concentration-response curves produced by acetylcholine (ACh) in the tail vascular beds previously contracted with potassium chloride (KCl, 65 mM) (C) Concentration-response curves produced by sodium nitroprusside (SNP) in the tail artery bed previously contracted with with potassium chloride (KCl, 65 mM). The number of preparations is indicated in parenthesis. The results are expressed as the means ± SEM. * P<0.05 for Rmax: CT vs. Malnutrition, Student's t-test.

