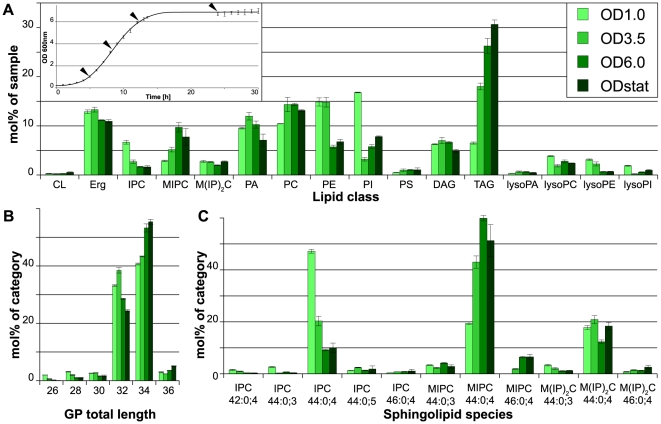
Figure 3. Lipidomics of yeast in different growth phases.
Yeast cells were grown in SCglc at 30°C and harvested in early logarithmic (OD1), middle logarithmic (OD3.5) and early stationary (OD6) phase as well as after overnight growth (ODstat). A) Lipid class composition in mol% of total lipids in the sample. LysoPS and ceramides as minor constituents are not shown. Inset: Growth curve with data points indicated by arrowheads. B) Total length of glycerophospholipids in mol% of category. Lysospecies and cardiolipin lengths are omitted for clarity. C) Sphingolipid species profile in mol% of category. All data were calculated from n = 3 independent samples ± SD. For the lipid nomenclature, sample names and experiment description see Materials and Methods.

