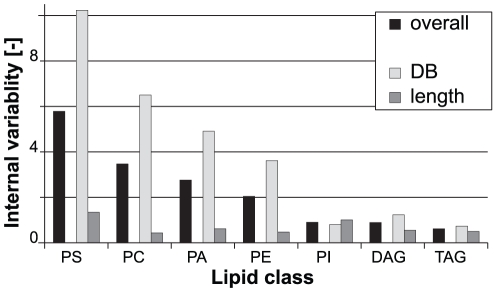
Figure 5. Internal variability of lipid classes.
The internal variability was calculated by averaging the variance-to-mean ratio (VMR) of the length and DB features of the respective lipid classes across the entire sample set (“overall”). Individual calculation of the average VMR of the length and DB features, respectively, reveals that the overall internal variability of a lipid class is largely determined by changes in the DB features (“DB” vs. “length”).

