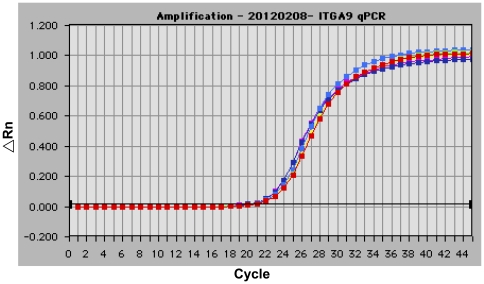
Figure 3. Real-time PCR analysis of ITGA9.
Representative RT-PCR plot resulting from the amplification of the ITGA9 gene using primer pairs of q1F/q1R (duplicated tests; red and green lines), qIVS1F/qIVS1R (duplicated tests; yellow and blue lines) and q15F/q15R (duplicated tests; violet and purple lines; PATIENTS AND METHODS). No evidence for the existence of duplicated segments in the 5′ -end of ITGA9 indicated a false-positive result of aCGH, as shown in Figure 2.

