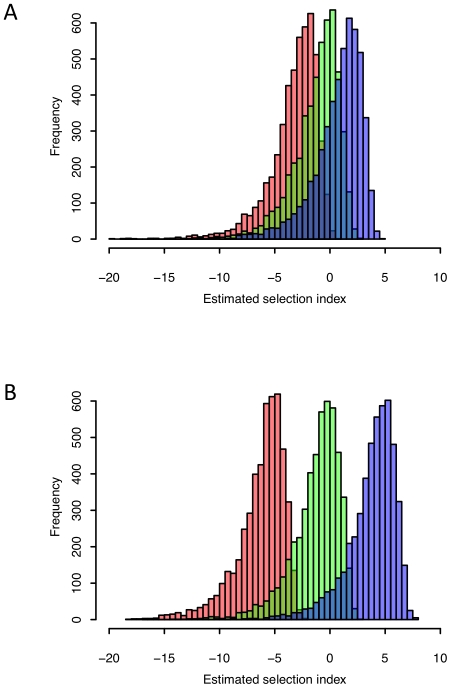
Figure 2. Estimates of the selection index for individual genes under different evolutionary scenarios, assuming that all measurements are without error and can be obtained from an infinite number of individuals.
A. Genes with true SI = −2 (negative selection) in red, genes with true SI = 0 (neutral evolution) in green and genes with true SI = 2 (positive selection) in blue. B. Genes with true SI = −5 in red, true SI = 0 in green and true SI = 5 in blue.

