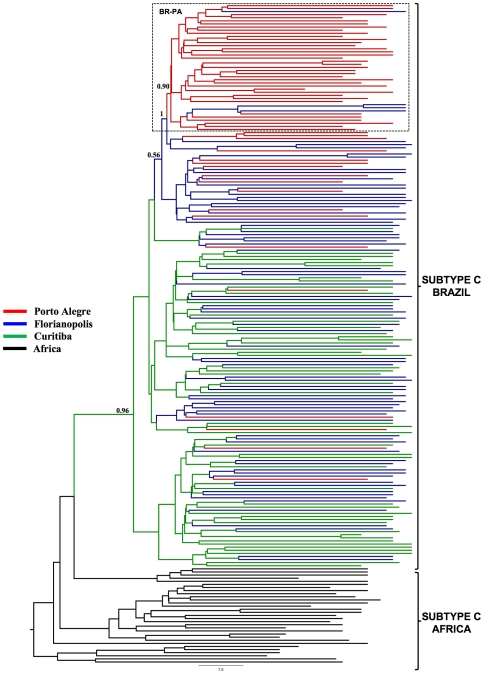
Figure 3. Bayesian MCC tree for HIV-1 subtype C pol (PR/RT) sequences circulating in Brazil.
Branches are colored according to the most probable location state of their descendent nodes. The legend for the colors is shown on the left. Brackets indicate the monophyletic clade formed by subtype C sequences sampled from Brazil, and the position of subtype C reference sequences of African origin used to root the tree. The box highlights the position of the sub-cluster BR-PA. The state posterior probability is indicated only at key nodes. Horizontal branch lengths are drawn to scale with the bar at the bottom indicating years.

