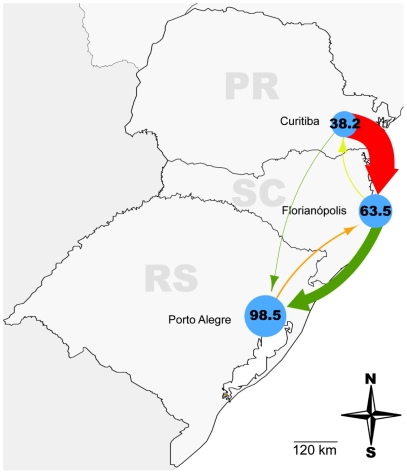
Figure 4. HIV-1 subtype C migration rates and routine traffic of people amongst the three states of the South Brazilian region.
Capitals are represented by blue circles proportional to the incidence of AIDS cases per 100,000 inhabitants in each city in 2009 [1]. The arrows are colored according to the routine traffic between states [41], from green (less) to red (more) passing through yellow, and their thickness is proportional to HIV-1 subtype C migration rate between state capitals as measured by BayesTraits. HIV-1 subtype C migration rate from Porto Alegre to Curitiba was more than 100 fold smaller than any of the others and is not represented in this picture.

