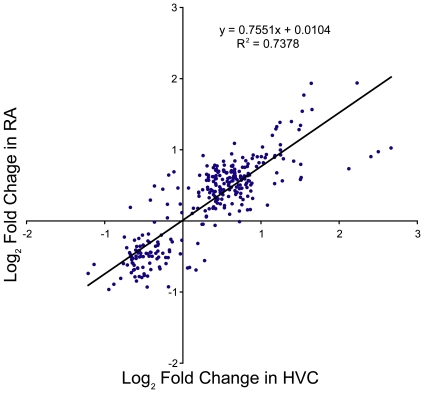
Figure 3. Genes in common between HVC and RA co-vary in expression.
Scatter plot of the log-fold change in gene expression for the 59 genes shared between HVC and RA that varied by more than 1.5 fold in at least one time point. The expression at all five time points relative to SD-long term for each of the 59 genes is illustrated.

