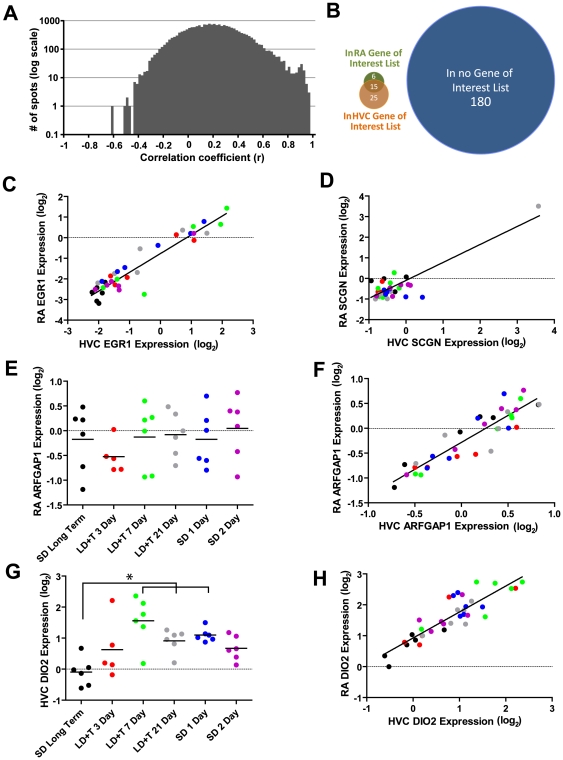
Figure 11. Many genes showed correlated pattern of expression between HVC and RA.
(A) A frequency histogram (bin size = 0.02) of correlation coefficients for each spot on the array comparing HVC to RA is positively-skewed, indicating that genes that were correlated between HVC and RA were positively correlated. (B) Venn diagram illustrating the proportion of genes that were significantly correlated between HVC and RA that also appeared in the HVC and/or RA gene of interest lists that vary in expression across seasonal conditions. The vast majority of genes that showed correlated expression in HVC and RA were not represented in either list. (C) Expression of EGR1 in HVC was correlated with expression of EGR1 in RA. (D) SCGN is an example of a gene that had a very high Pearson's coefficient (r2 = 0.740) that was entirely dependent upon a single outlier. (E) Expression of ARFGAP1 did not vary significantly across breeding conditions in (F) RA or HVC but was positively correlated in expression between HVC and RA. (G) Expression of DIO2, a gene critical for thyroid hormone metabolism, varied significantly across breeding conditions in (H) HVC and RA (Table S2) and was positively correlated in expression between HVC and RA. Expression values are illustrated relative to the universal reference sample.

