
Figure 3.
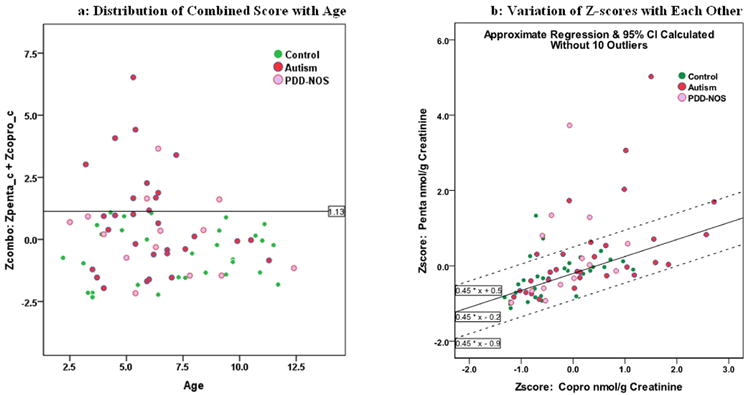
Distribution of Z-scores. Figure 3a shows the graphical distribution of the combined Z-scores by age among AUT, PDD-NOS and NT subjects. Figure 3b shows the individual Z-scores plotted against each other and their regression slope and 95% CI after eliminating 10 ‘outlier’ cases.