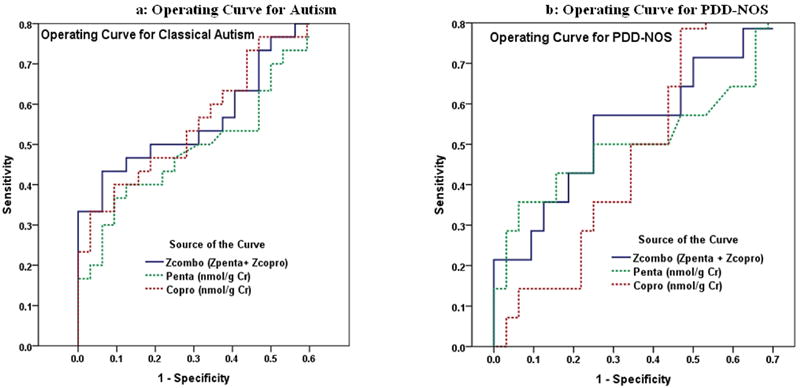
Figure 4.

Receiver Operating Characteristic (ROC) Curves for 3 Porphyrin Measures Predicting Autism and PDD-NOS. Individual lines depict the proportion of AUT (Figure 4a) or of PDD-NOS (Figure 4b) identified as true positives (Sensitivity) in relation to the proportion identified as false positives (1- Specificity), from among all 76 study subjects (30 AUT + 14 PDD-NPS + 32 NT).
