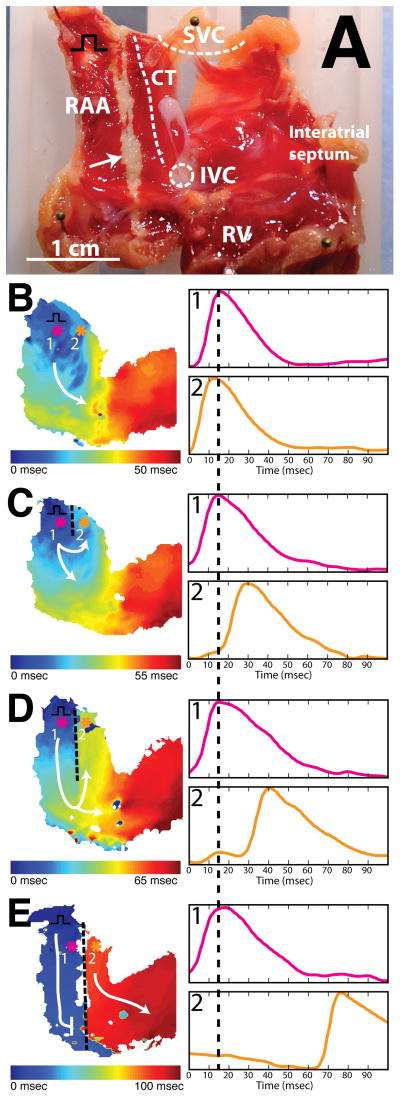
Figure 3.
Demonstration of continuous linear ablation. A: Endocardial view of right atrial preparation post TTC staining. Black square pulse represents pacing location. B: Activation map before HIFU ablation during pacing (CL = 250ms). Colored asterisks indicate location of optical signals. White arrow indicates ablation line. C: Activation map after creation of 5mm lesion with HIFU during pacing (CL = 250ms). D: Activation map after creation of 15mm lesion with HIFU during pacing (CL = 250ms). E: Activation map after creation of complete block with HIFU during pacing. As lesion length increases (C & D), larger conduction delay is observed between optical signals from pixel 1 (pink) and pixel 2 (orange). After entire conduction path has been ablated (E), sinus node drives electrical excitation on right side of preparation.

