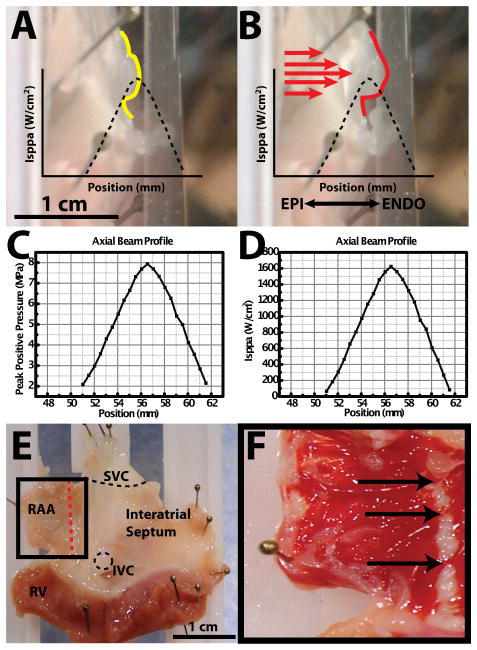
Figure 5.
Acoustic radiation force. A: Side profile of right atrial preparation before HIFU application. Yellow trace indicates profile of tissue surface. Black dashed trace indicates axial beam profile relative to tissue surface. B: Side profile of right atrial preparation during HIFU application. Red trace indicates displaced profile of tissue surface. Red arrows indicate direction of HIFU application. C: Peak positive pressure axial beam profile as a function of postion from transducer face. D: ISPPA axial beam profile as a function of position from transducer face. E: Right atrial preparation. Red line indicates ablation line. F: TTC staining post ablation. Arrows indicate gaps in ablation line.

