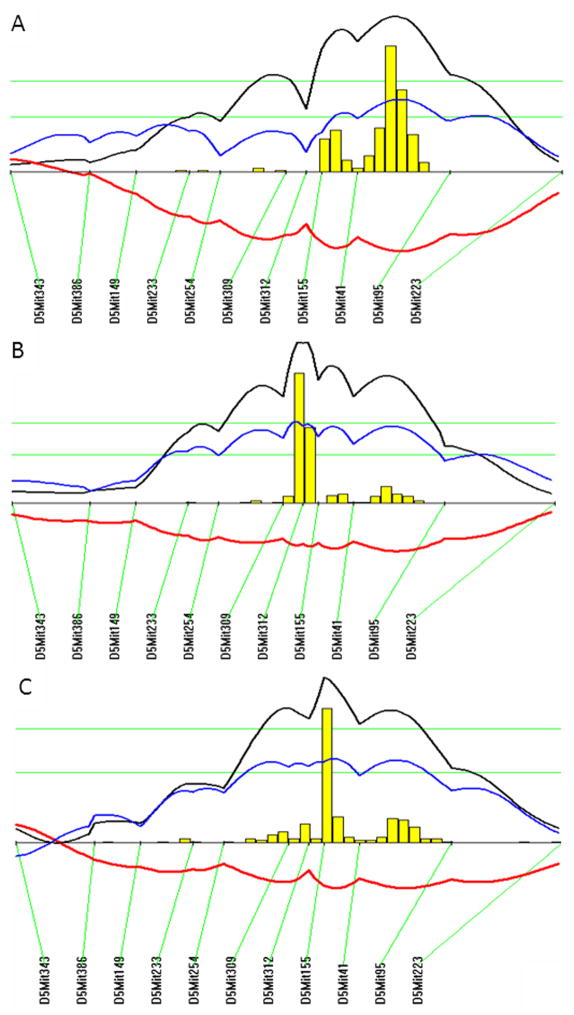
Figure 6.
LOD score plots for atherosclerotic lesion size (A), fasting plasma glucose levels on the chow diet (B), and fasting plasma glucose levels on the Western diet (C) on chromosome 5. Plots were created with the interval mapping function of Map Manager QTX, including a bootstrap test shown as a histogram estimating the confidence interval for the QTL. Two green horizontal lines represent genome-wide significance thresholds for suggestive or significant peaks (P=0.63 and P=0.05, respectively). Black plots reflect the LOD calculated at 1-cM intervals. The blue plot represents the effect of the B6 allele, and the red plot represents the effect of the BALB allele.

