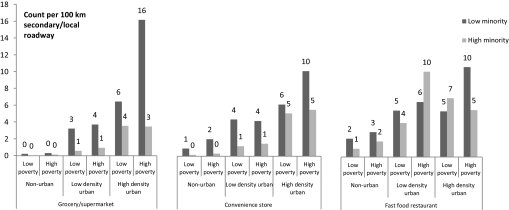
Figure 1.
Predicted neighbourhood food resource availability (count per 10 000 population) for various neighbourhood poverty* and minority population† levels‡. *Greater than 20% of population below the federal poverty level. †Per cent non-Hispanic White population. Non-urban (low: 0%–74.7%, medium: 74.8%–96.3%, high: 96.4%–100%), low-density urban (low: 0%–70.7%, medium: 70.8%–90.5%, high: 90.6%–100%), high-density urban (low: 0%–31%, medium: 31.1%–63.7%, high: 63.8%–10%). ‡National Longitudinal Study of Adolescent Health Wave III (young adulthood: 2001–2002), corrected for clustering and weighted for representation. Estimated from urbanicity-stratified regression modelling food resource availability (within 3 km network buffer) as a function of neighbourhood poverty status (>20% population below federal poverty level compared with ≤20% of population below federal poverty level) and percent non-Hispanic White population. Non-urban (Low:0-74.7%, High: 96.4-100%), Low density urban (Low: 0-70.7%, High: 90.6-100%) High density urban (Low: 0-31%, High: 63.8-10%) For simplicity, predictions for medium neighbourhood minority population are not reported.

