
Figure 1.
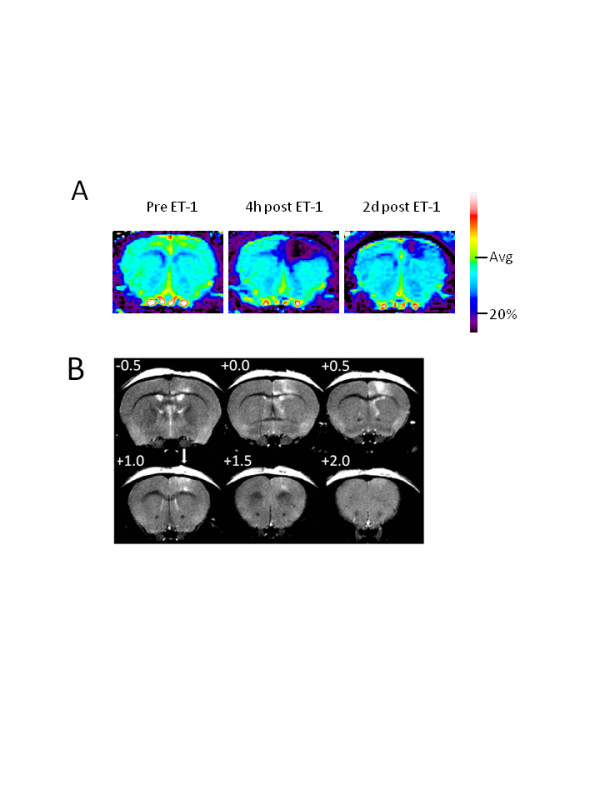
Perfusion weighted and T2 weighted MR images after cortical injection of 1 μl ET-1. A. Representative perfusion weighted MR images obtained from a Wt mouse before injection (pre; left) of ET-1 (400 pmol; 1 μl), and at 4 hours (4 h; middle) and 48 hours (2 d; right) post-ET-1 injection. Pseudocolor scale bar shows average cerebral blood flow (CBF) pre-injection (Avg) and ischemic threshold, set at 20% of pre-injection average (20%). B. Representative T2 weighted MR images obtained from a Wt mouse 48 hours post-injection of ET-1. In each panel, the number at the upper left shows the position relative to bregma. The arrow shows the injection site at +1.0 mm anterior to bregma.