Figure 5.

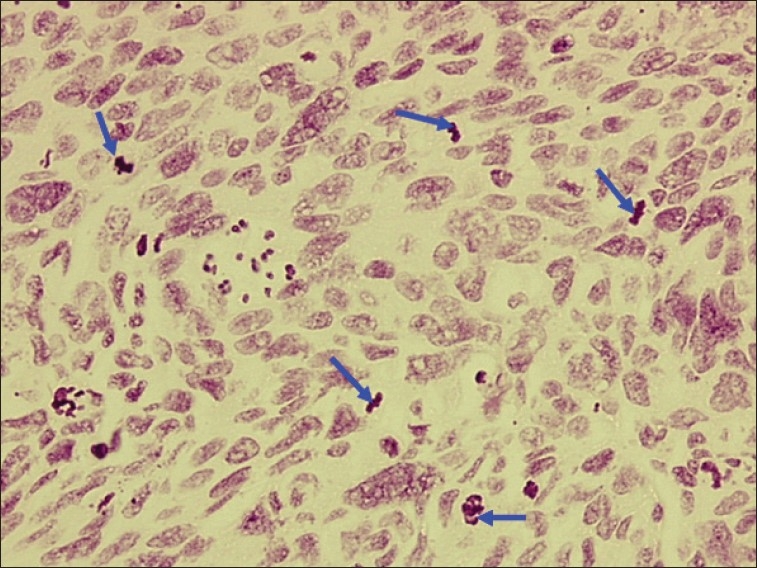
Photomicrograph of poorly differentiated OSCC showing anisonucleosis and numerous abnormal mitotic figures (blue arrows). Objective 20×, Feulgen stain

Photomicrograph of poorly differentiated OSCC showing anisonucleosis and numerous abnormal mitotic figures (blue arrows). Objective 20×, Feulgen stain