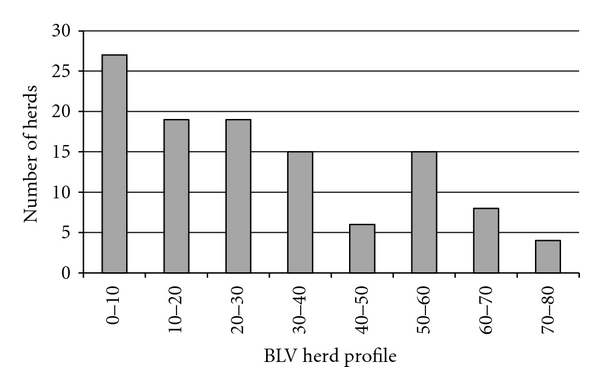
Figure 1.

Frequency distribution of Bovine Leukemia Virus herd profile (BHP) for 113 dairy herds in Michigan. For each herd, the percent of cows that tested Bovine Leukemia Virus (BLV) positive within the first, second, third, and fourth or greater lactations (ten cows from each lactation) was averaged to calculate the BHP. The 25th, 50th, and 75th percentiles were 14.6, 30.0, and 48.9, respectively.
