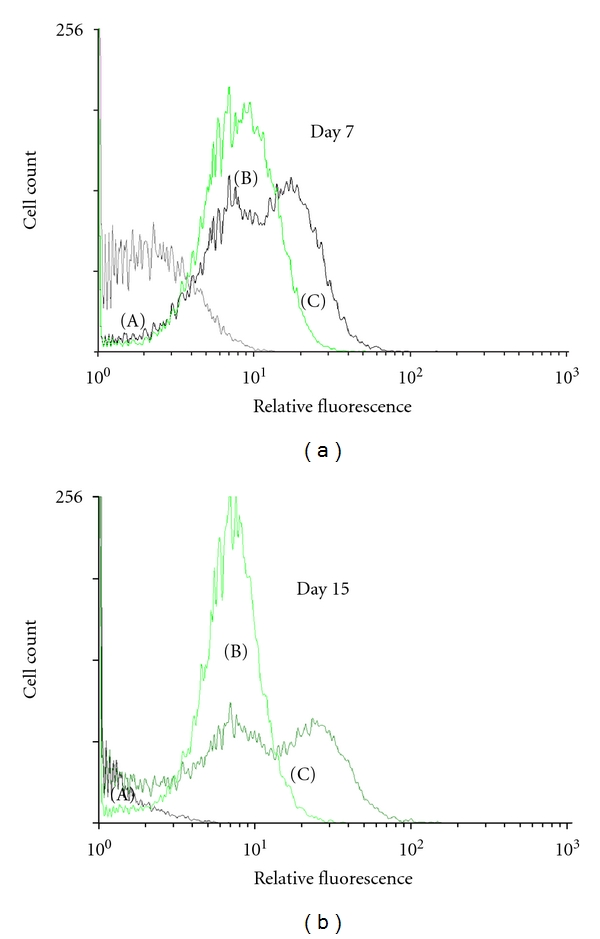
Figure 2.

FACS analysis of GFP expression in nontransfected and transfected cNPCs. FACS analysis was performed on nontransfected and transfected cNPCs to show the expression of the GFP reporter gene. The vertical axis shows cell count, and the horizontal axis shows relative fluorescence. (a) Nontransfected cNPCp25 cultured in UM; (b) transfected cNPCp25 cultured in UM; (c) transfected cNPCp25 cultured in UM containing 10% FBS for 7 days (a) and 15 days (b).
