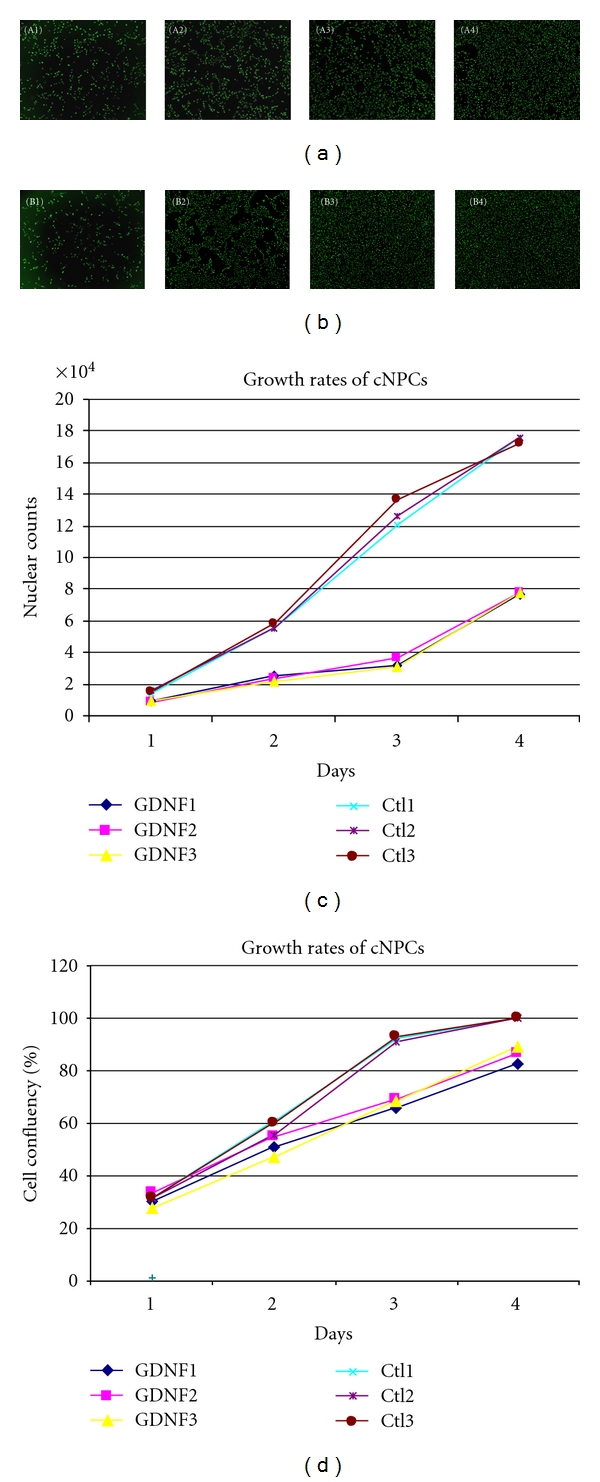
Figure 3.

Growth of nontransfected and pCAG-PyF101-eGDNF plasmid transfected cNPCs. The fluorescence stained nuclei of (a) transfected and (b) nontransfected cNPCs. cNPCs were cultured in 24-well plate in UM for 4 days. Cells were labeled with a marker for nuclear DNA, and an IncuCyte live cell monitoring system was used to assess the growth rate of cells on each day. (a) GDNF-transfected cNPCs; A1–4: Day1–4. (b) Nontransfected cNPCs; B1–4: Day1–4. (c, d) Growth curves of GDNF-transfected and nontransfected cNPCs (labeled GDNF and Ctl, resp.) imaged and analyzed using an IncuCyte live cell monitoring system. Cells were stained with Vybrant Dycycle fluorescence nuclear-specific dye daily for 4 consecutive days (c). At the same time, cells in duplicate sets of wells without nuclear stain were measured for percentage cell confluency (d). The tight grouping of control data in (d) makes it difficult to discern Ctl1, which is present in the upper group and reaches confluence rapidly along with the other nontransfected cNPCs. IncuCyte programs were used for both analyses (c, d).
