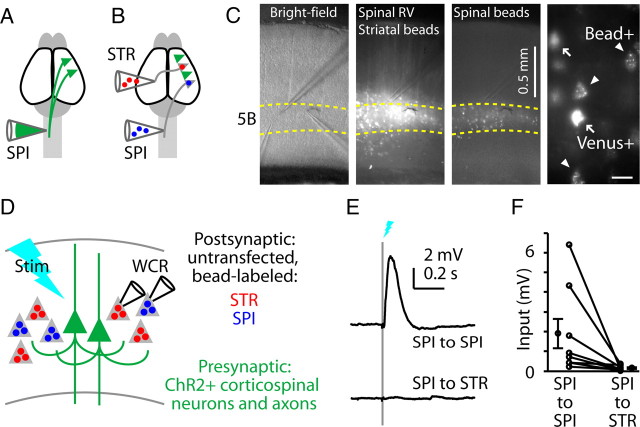
Figure 2.
Asymmetric output from photostimulated corticospinal neurons to untransfected corticospinal and corticostriatal neurons. A, Schematic depicting retrograde transfection of corticospinal neurons (SPI) with RV-ChR2. B, Schematic depicting retrograde anatomical labeling of corticospinal and corticostriatal (STR) neurons with fluorescent tracers. C, Images of brain slices of motor cortex containing the labeled neurons. Left to right: low-power bright-field, green (Venus and green beads), and red (red beads) fluorescence images. Green beads and red beads were injected into the striatum and spinal cord, respectively. Far right, Higher-magnification image showing readily distinguishable labeling patterns of transfected corticospinal neurons expressing Venus (arrows, ChR2+) and other corticospinal neurons retrogradely labeled with fluorescent beads only (arrowheads). Scale bar, 25 μm. D, Schematic depicting the in vitro stimulation (Stim) and recording paradigm (WCR, whole cell recording). E, Example responses to corticospinal stimulation, recorded simultaneously in untransfected corticospinal (blue) and corticostriatal (red) neurons. F, Group analysis. Lines connect data points from individual pairs. Group means (±SEM) are plotted to either side.

