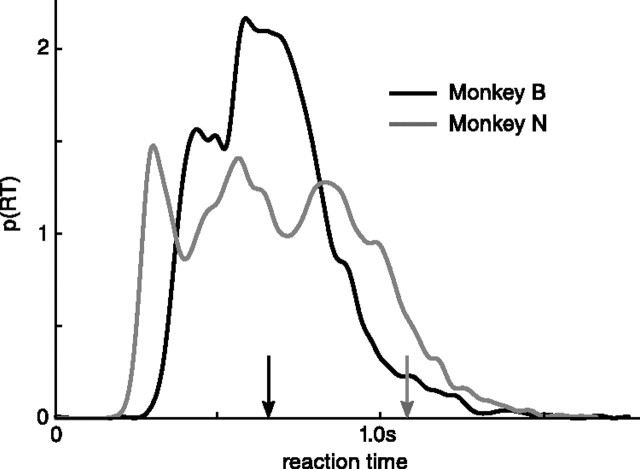
Figure 11.
Full reaction time distribution of monkeys. The reaction time distributions are plotted using Gaussian kernel smoothing (width 20 ms). The arrows along the abscissa indicate the effective minimum reward time. For all decisions occurring before this time, administration of the reward is delayed until the minimum reward time has passed. Nonetheless, >51 and >92% of all decisions for monkey B and N, respectively, are made before the minimum reward time.

