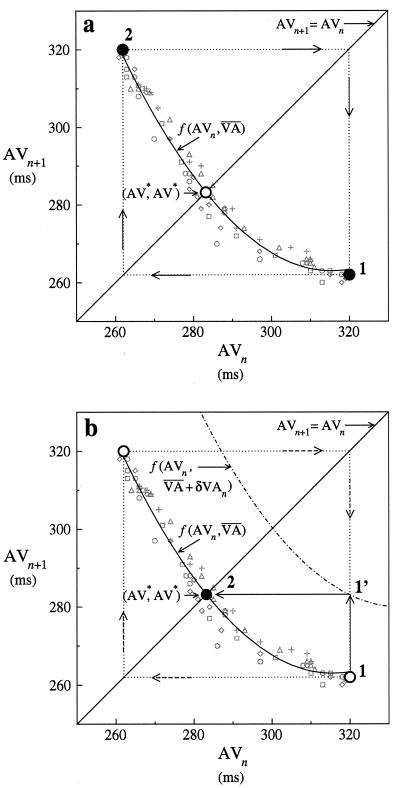
Figure 2.
A schematic of AV interval dynamics without (a) and with
(b) control. In both panels the schematic is
superimposed over five series of AV intervals (annotated with different
gray symbols) that correspond to consecutive control attempts at the
same nominal VA interval in one alternans pacing and control trial.
These AV intervals immediately followed control termination, and
therefore obeyed f(AVn,
 ) as they drifted away from the unstable steady state AV*
and back into alternans. Thus,
f(AVn,
  ) was
approximated by a quadratic curve fit to the AV intervals. The
intersection of f(AVn,
 ) with the line of identity (the diagonal line
AVn+1 = AVn) is the
unstable steady state AV*. Without control (a), the AV
intervals alternate indefinitely between points 1 and 2 via the dynamic
route depicted by the dotted lines, and never explore the unstable
interior region of f(AVn,
 ). b shows how the VA control perturbation
of Eq. 3 shifts the function along the line of identity to
the location of the dash-dot curve
f(AVn,
  +
δVAn). By doing so, point 1 becomes point 1′
(i.e., AVn+1 is increased). When the
function is returned to f(AVn,
 ) at the next beat (i.e.,
δVAn+1 = 0), control succeeds as the AV
interval progresses to point 2, which is at the unstable steady state
AV*.

