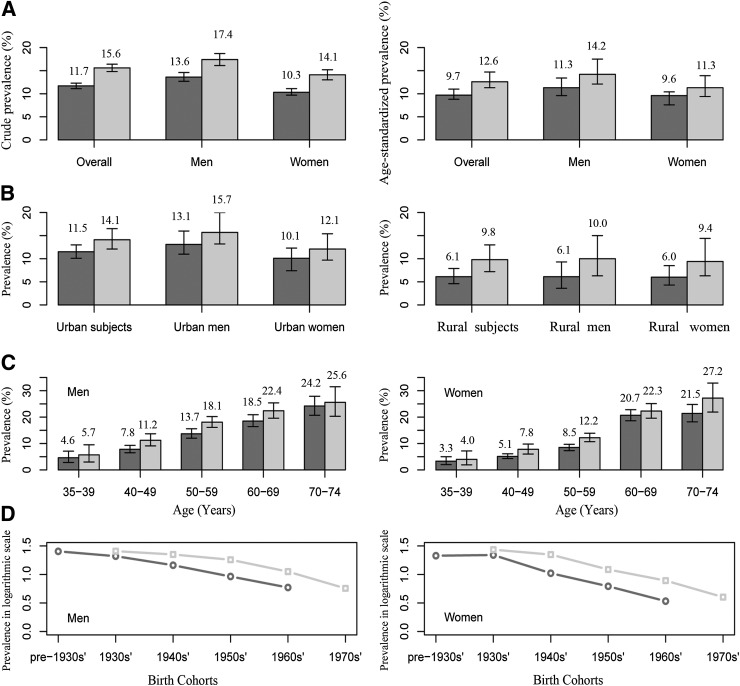
Figure 1.
Comparison of prevalence of type 2 diabetes in the 2002–2003( ) and 2009(
 ) surveys. I bars indicate 95% CIs. A: Crude and age-standardized prevalence. B: Age-standardized prevalence in urban and rural areas. C: Age-specific prevalence in men and women. D: Prevalence by birth cohort in men and women (logrithmic scale).

