
Figure 3.
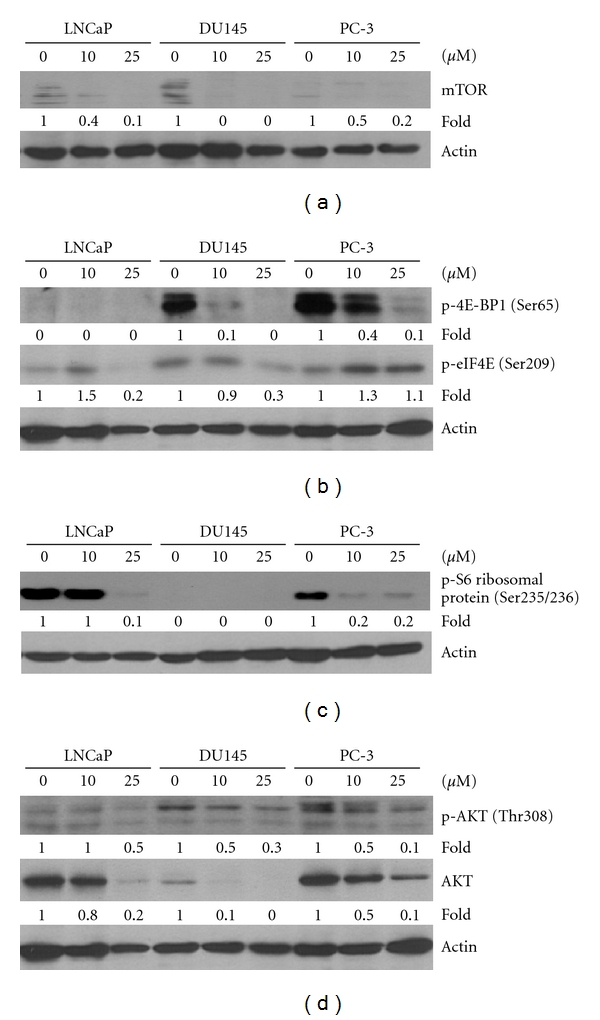
Effects of exposure to piceatannol on mTOR and its downstream p-4E-BP1/p-eIF4E and upstream AKT expression in LNCaP, DU145, and PC-3 cells. Cells were treated with varying concentrations of piceatannol (0, 10, and 25 μM) for 72 h, and immunoblot analysis was used to assess the changes in protein levels of (a) mTOR, (b) phosphorylated p-4E-BP1 (Ser65), and p-eIF4E (Ser209) (c) phosphorylated p-S6 ribosomal protein (Ser235/236), (d) total and phosphorylated AKT (Thr308). In each case, actin was used as a loading control. The intensity of the specific immunoreactive bands was densitometrically quantified and expressed as a fold difference against actin.